Home » Free Printables » Printable Graph Paper » Ternary Diagram Graph Paper
Free Ternary Diagram - Triangular Graph Paper
Download and print as many triangular grid template sheets as you need
What is Triangular Graph Paper?
Triangular graph paper is used to graph the relationships between three variables on an equilateral triangle. This type of two-dimensional graph can be made when the sum of the three variables always adds up to a constant - usually 100% or 1. The charts produced from this method of graphing are generally referred to as "ternary plots" or "ternary diagrams." They are frequently used to plot the compositions of mixtures in physical chemistry, petrology, mineralogy, metallurgy and other physical sciences. Ternary plots are also used in genetics and game theory.About our Triangular Graph Paper
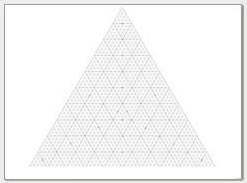
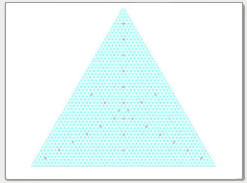
We have two types of triangular graph paper, one with black lines and one with blue. Choose the paper that will contrast with the pencil or pen color that you will be plotting with. These papers are provided as printable .pdf documents. They are designed to print on a standard sheet of 8 1/2 x 11 paper. They can be opened and printed with a .pdf document reader such as Adobe Reader.Plotting Example: Igneous Rocks
In petrology, plutonic igneous rocks are classified by the relative abundance of quartz (Q), plagioclase (P), and alkali feldspar (A) in their composition. A field classification chart is shown below. By this chart, rocks that contain greater than 60% quartz are known as "quartz-rich granitoids," those that contain between 20% and 60% quartz are known as "granitoids." Those that contain less than 20% quartz and are rich in alkali feldspar are known as "syenitoids." Other rocks are either dioritoids, gabbroids, or anorthosites.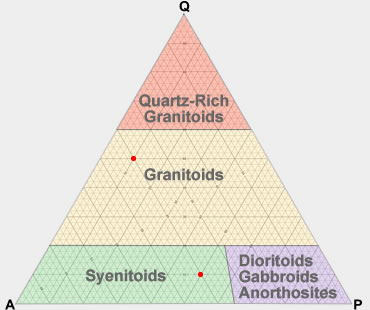
Two red points are plotted on the chart. One is at a composition of 50% quartz, 40% alkali feldspar, and 10% plagioclase. That composition makes the rock a "granitoid." Another rock plots at 10% quartz, 40% alkali feldspar, and 50% plagioclase, making the rock a "syenitoid."
Plotting Example: Feldspar Minerals
One of the most familiar examples of a triangular plot in the Earth sciences illustrates the classification of feldspar minerals.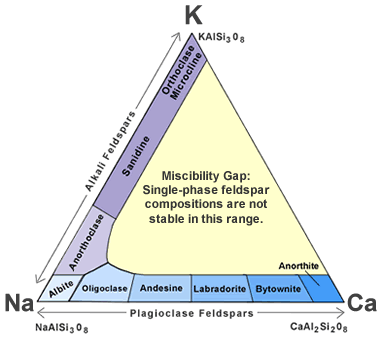
The left edge of the plot represents the solid solution series of the alkali feldspars. The solid solution series of the plagioclase feldspars is along the base of the triangle.
Plotting Example: Sedimentary Rocks
In a study of the Devonian Shales in the Broadtop Synclinorium of the Appalachian Basin, the United States Geological Survey used ternary diagrams to graphically illustrate the compositional characteristics of the rock units.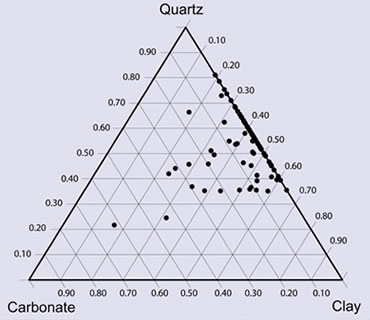
The plot above shows that most samples were dominated by detrital minerals, quartz, and clay, rather than by carbonates.
ADVERTISEMENT
More about Triangular Graph Paper
[1] Free Printable Graph Paper, Our collection of twenty different graph paper designs that you can print and use for free. WaterproofPaper.com.[2] Ternary Plot, Summary article about ternary plots. Wikipedia article, last accessed 05/2020.
[3] Flammability Diagram, An example of how a triangular plot can be used to illustrate the flammability of all possible mixtures of methane, oxygen, and nitrogen. Wikipedia article, last accessed 05/2020.
[4] QFL Diagram, An example of how a triangular plot can be used to determine the provenance of sandstones based upon their quartz (Q), feldspar (F), and lithic fragment (L) composition. Wikipedia article, last accessed 05/2020.
[5] Geochemical and Mineralogical Sampling of the Devonian Shales in the Broadtop Synclinorium, Appalachian Basin, in Virginia, West Virginia, Maryland, and Pennsylvania. Ternary plots were used to graphically portray the mineralogical composition of Devonian Shale samples. USGS website, last accessed 05/2020.
[6] Ternary Diagram Basics, Short YouTube video that explains how to read and prepare ternary diagrams. Engineer Clearly video, last accessed 05/2020.
[7] Ternary Diagram of Feldspar Minerals in an article about feldspar minerals on the Geology.com website. Last accessed 01/2021.


